
What We Learned from 2022 Q4
Breaking down and comparing the metrics of Q4 ad performance
february 7, 2023
We spent a bit of time in January reviewing Q4 Sponsored Ads performance metrics and sharing our findings with our colleagues and friends on social. If you missed those posts or don’t have time to scrub back through (hey, we get it), have no fear – you have made it to the article that will provide you with all the findings in one spot!
Before we dive into the details of this breakdown, keep in mind that these are overall averages spread between different categories, products, price points and overall advertising objectives. We also utilize Amazon DSP for most audience targeting and upper funnel strategies which is not included in this data set. We focused on Sponsored Ads.
Your individual results may vary (like ours do between accounts and categories) but we thought these figures could be helpful as a benchmark. This data set included almost 3 billion impressions and over 10 million clicks from Q4 of 2022.
ROAS Comparison
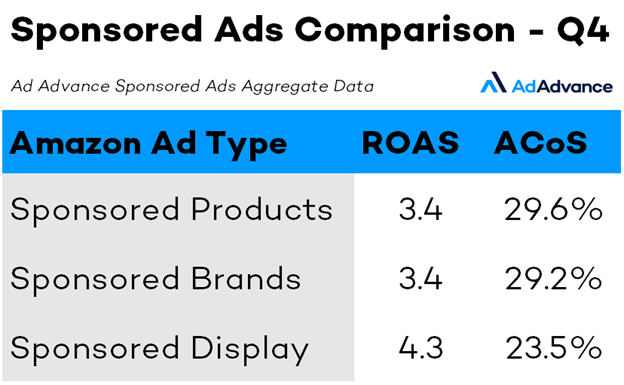
When comparing advertising results between Sponsored Products, Brands and Display, there was one clear winner for the best ROAS. And this may surprise you…
Sponsored Display!
We saw an average ROAS of 3.4 (about a 29% ACoS) for both Sponsored Products and Brands while we achieved a ROAS of 4.3 for Sponsored Display (an ACoS of 23.5%).
This may be a bit surprising until you look at how we use Sponsored Display.
Sponsored Display product targeting ads act a lot like Sponsored Products product targeting ads except that Sponsored Display typically has better placements on the product detail page (under the buy box and bullets).
Sponsored Display audience targeting ads actually had the best ROAS of any targeting type due to how we use them (ROAS of 5.6). We primarily use Sponsored Display audience targeting ads for retargeting and product repurchases.
Combining Sponsored Display audience targeting with upper funnel or outside traffic channels like Amazon DSP or Google Ads is a powerful combination that we saw pay off over the holidays
Sponsored Ads Spend Breakdown
Now, let’s analyze our ad sales in Q4 by the different ad types: Sponsored Products, Sponsored Brands and Sponsored Display.
We let ad strategy and performance data drive the ad sales allocation, so these values are a result of millions of optimizations at the target or campaign level, not top-down targets or specified budgets.
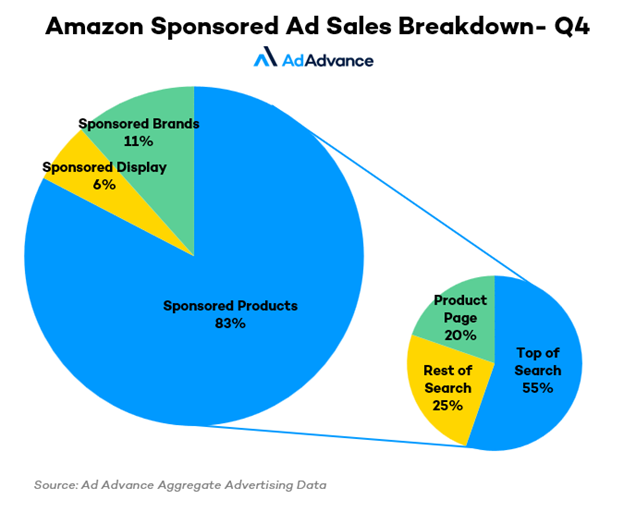
Overall, Sponsored Products drove 83% of the total ads sales compared to 11% for Sponsored Brands and 6% for Sponsored Display.
Since Sponsored Products drove a majority of the sales, we also broke down the placements of these ads in the graphic. Top of Search had 55% of the ad sales from Sponsored Products compared to 25% for Rest of Search and 20% for Product Page placements.
For Sponsored Brands, SB Video was the largest driver with 50% of the ad sales. This was followed by the Top of Search placement at 44% followed by Rest of Search at 5%.
Product Page targets made up 76% of the ad sales from Sponsored Display with Audience targeting ads making up the remaining 24%.
Sponsored Ad Sales by Placement
Can we break it down even further? We sure can! Let’s split apart the data based on the ad placement.
Sponsored Products
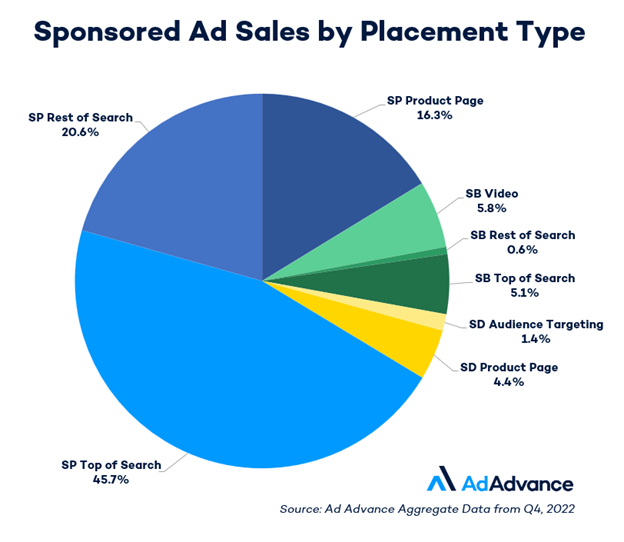
- Overall Sponsored Products attributed ad sales made up 82.6% of the total.
- Top of Search generated the most ad sales at 45.7% of the total, followed by Rest of Search at 20.6% and Product Page at 16.3%.
Sponsored Brands
- Sponsored Brands advertising made up 11.5% of the total ad sales.
- SB video ads drove 5.8% of the sales, followed by Top of Search at 5.1% and Rest of Search at 0.6%.
Sponsored Display
- Sponsored Display advertising drove 5.8% of the total Sponsored Ads attributed sales.
- Our largest sales driver was Product Page placements at 4.4% followed by Audience Targeting at 1.4%.
Metrics by Placement
Curious how the key metrics compare between the different ad types? Let’s dive in:
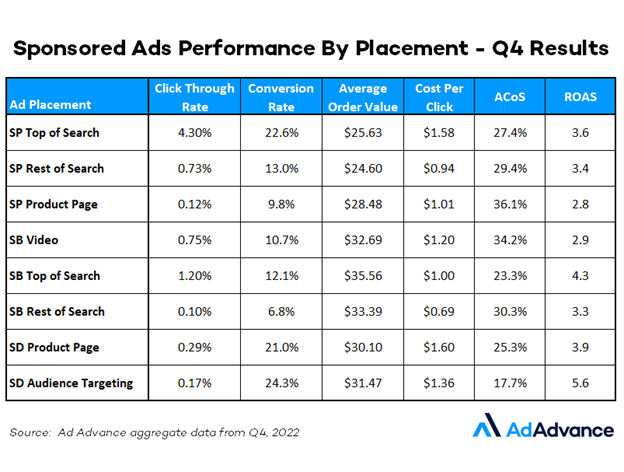
Click Through Rate: Top of Search ads took the win here for click through rate as usual. Sponsored Products TOS click through rates are significantly higher than any other ad type followed by Sponsored Brands TOS.
Conversion Rate: SD Audience targeting had the highest reported conversion rate but take that with a grain of salt. SD Audience targeting made up a small portion of our overall spend since we tend to run most audience targeting campaigns through Amazon DSP. When we do use this ad type, it’s typically lower funnel retargeting which uses view-based attribution so it’s not a direct comparison to click based conversion rates.
The next two highest performing placements were Sponsored Products Top of Search followed by Sponsored Display Product Page ads.
Average Order Value: The average sales per order were highest in Sponsored Brands campaigns followed by Sponsored Display. This makes sense since we tend to have a higher weighting of Sponsored Brands campaigns for higher priced products since they have a longer consideration period and require more mid-funnel advertising to drive conversions.
Cost Per Click: Sponsored Display Product Page placements where actually a bit more expensive than Sponsored Products Top of Search in Q4. SD Audience Targeting was next highest on a cost per click basis followed by Sponsored Brands Video ads.
Advertising Return: For the click-based attribution placements, Sponsored Brands Top of Search had the best ACoS and ROAS of any ad placement. This was followed by Sponsored Display Product Page placements and then Sponsored Products Top of Search.
Looking Ahead
The goal with sharing this aggregate data is to provide some benchmarks that we hope you’ll find helpful in making future strategic decisions. As always, there is a large mix of products in many categories where performance can vary significantly so keep that in mind when comparing to your own performance.
Talk to an Amazon Advertising Expert
- We’re Hiring – Programmatic Media Manager
- Amazon Marketing Stream: Key Hourly Metrics
- Five Amazon PPC Strategies
- What is Retail Media
- We’re Hiring – Software Engineer